Toronto’s Parking Lot Transformation
Imagery: City of Toronto (1978); Google Maps (2019)
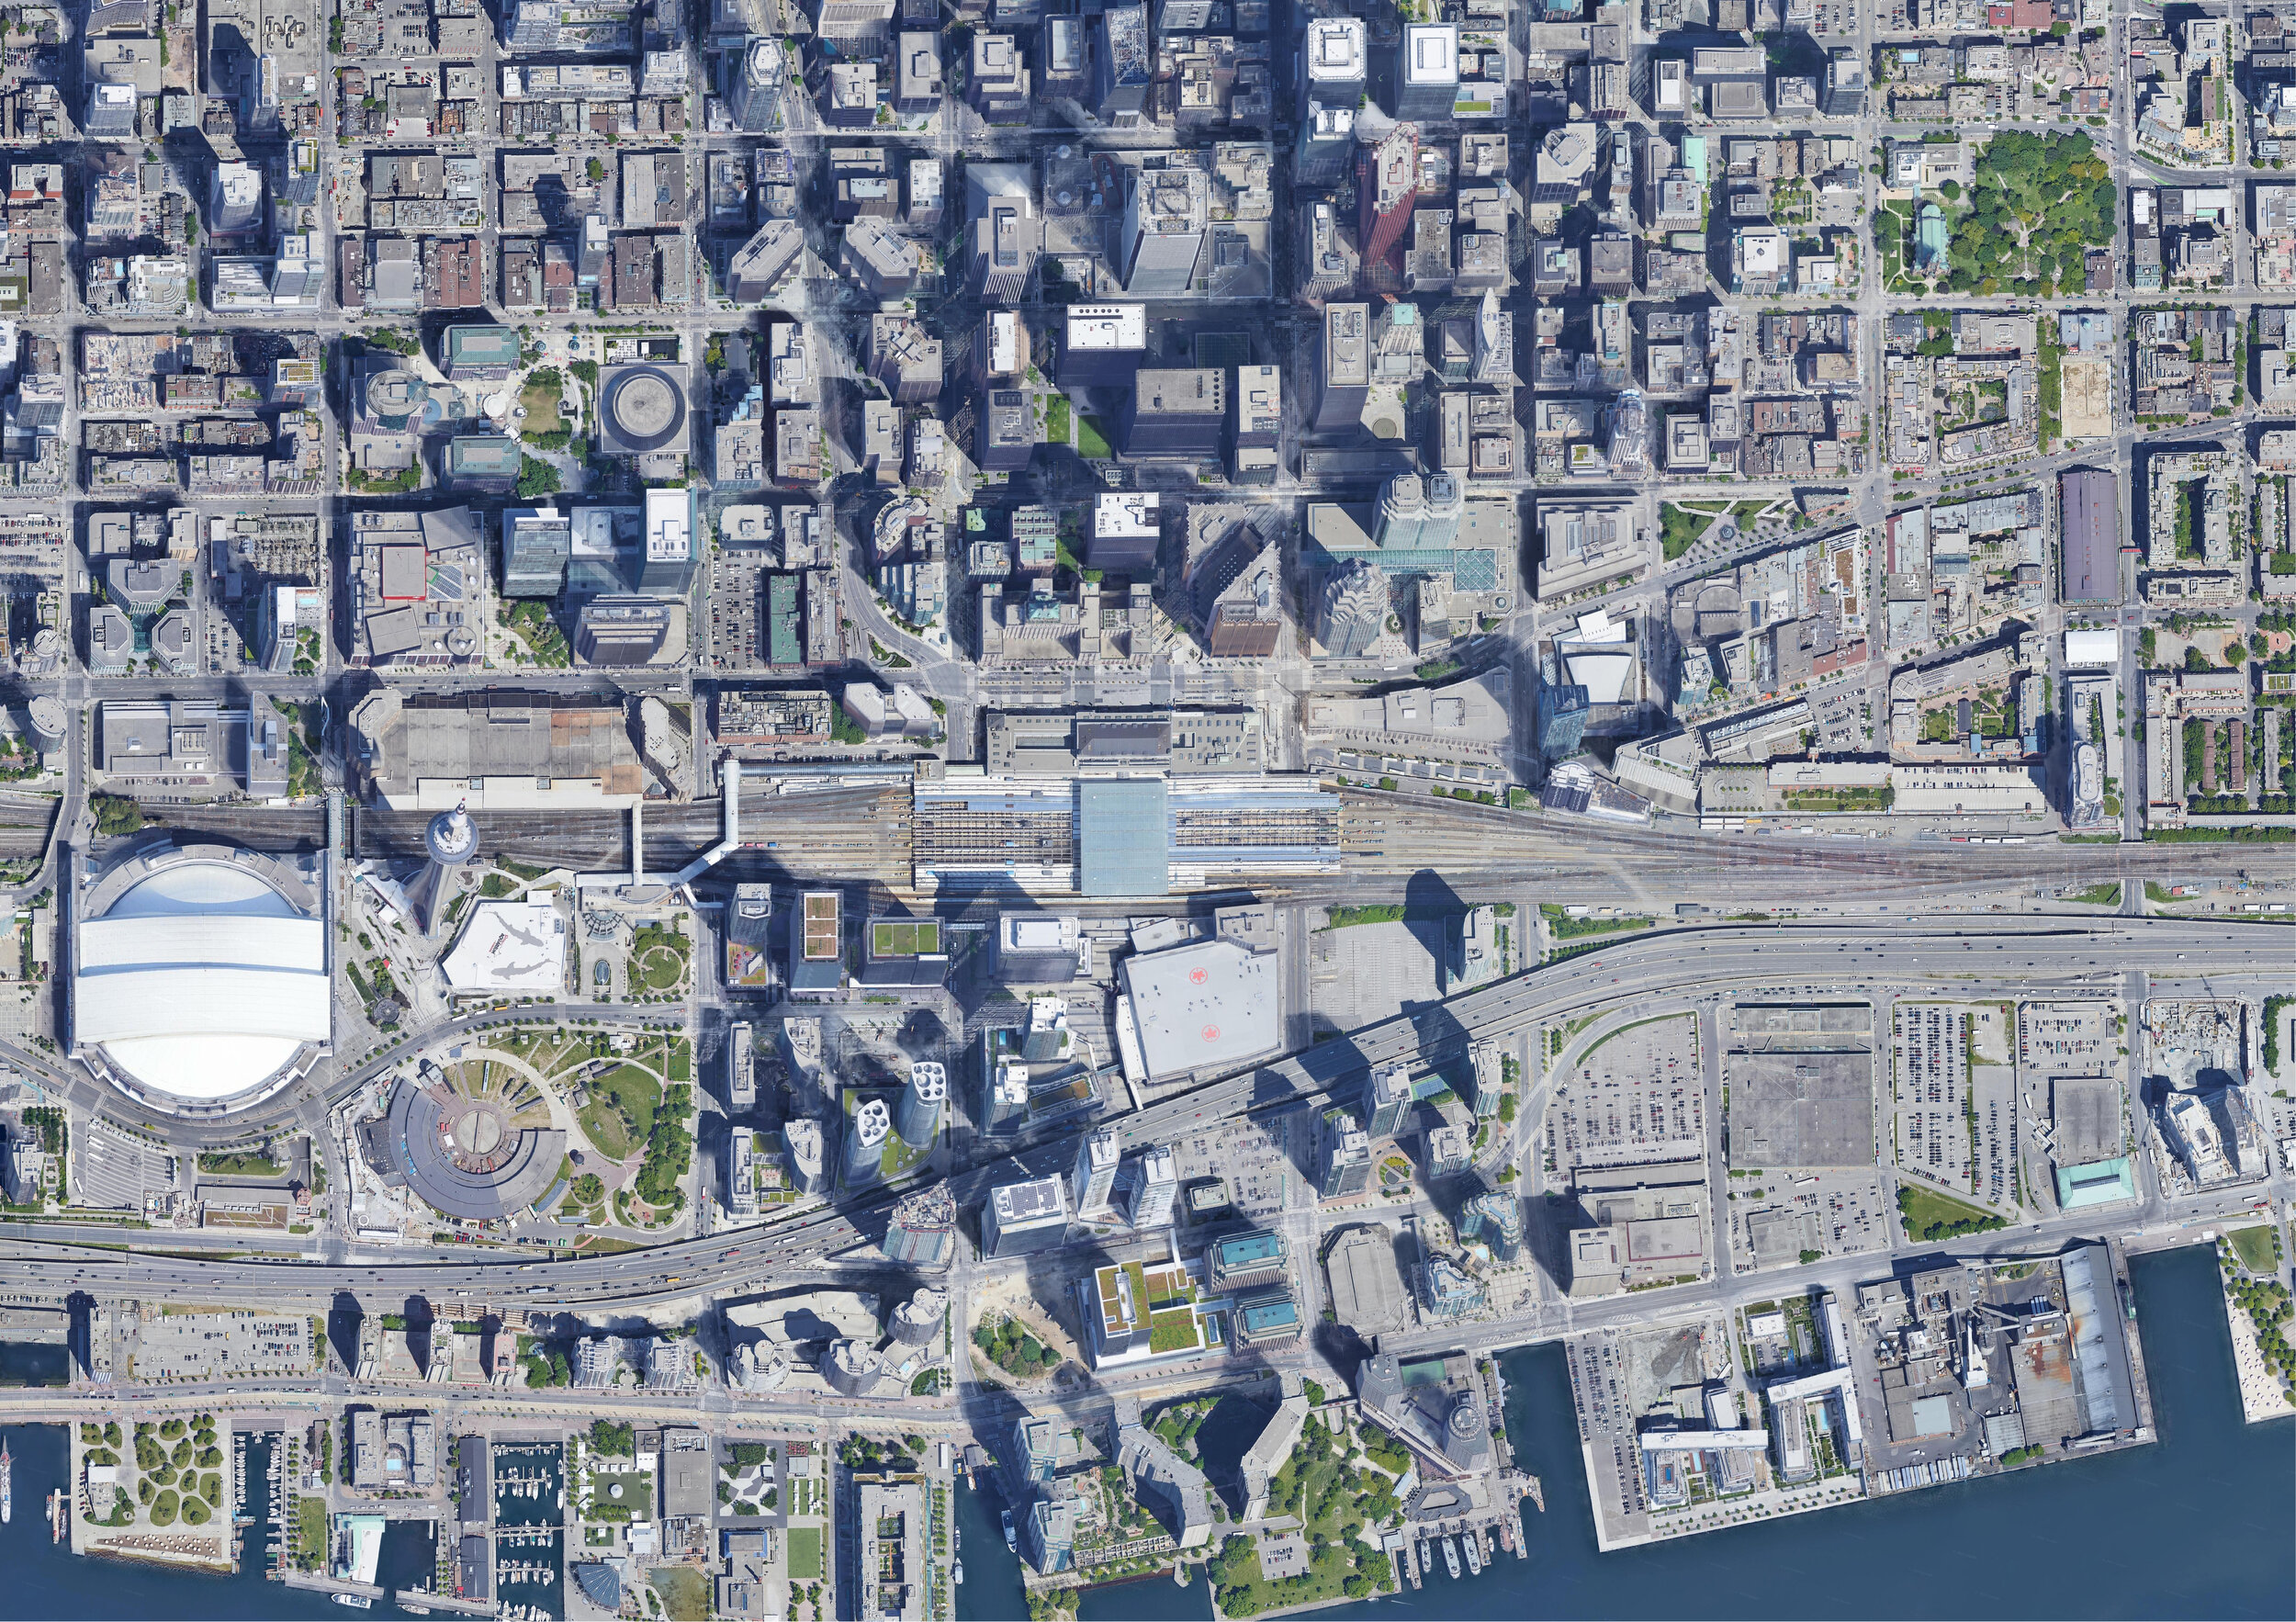
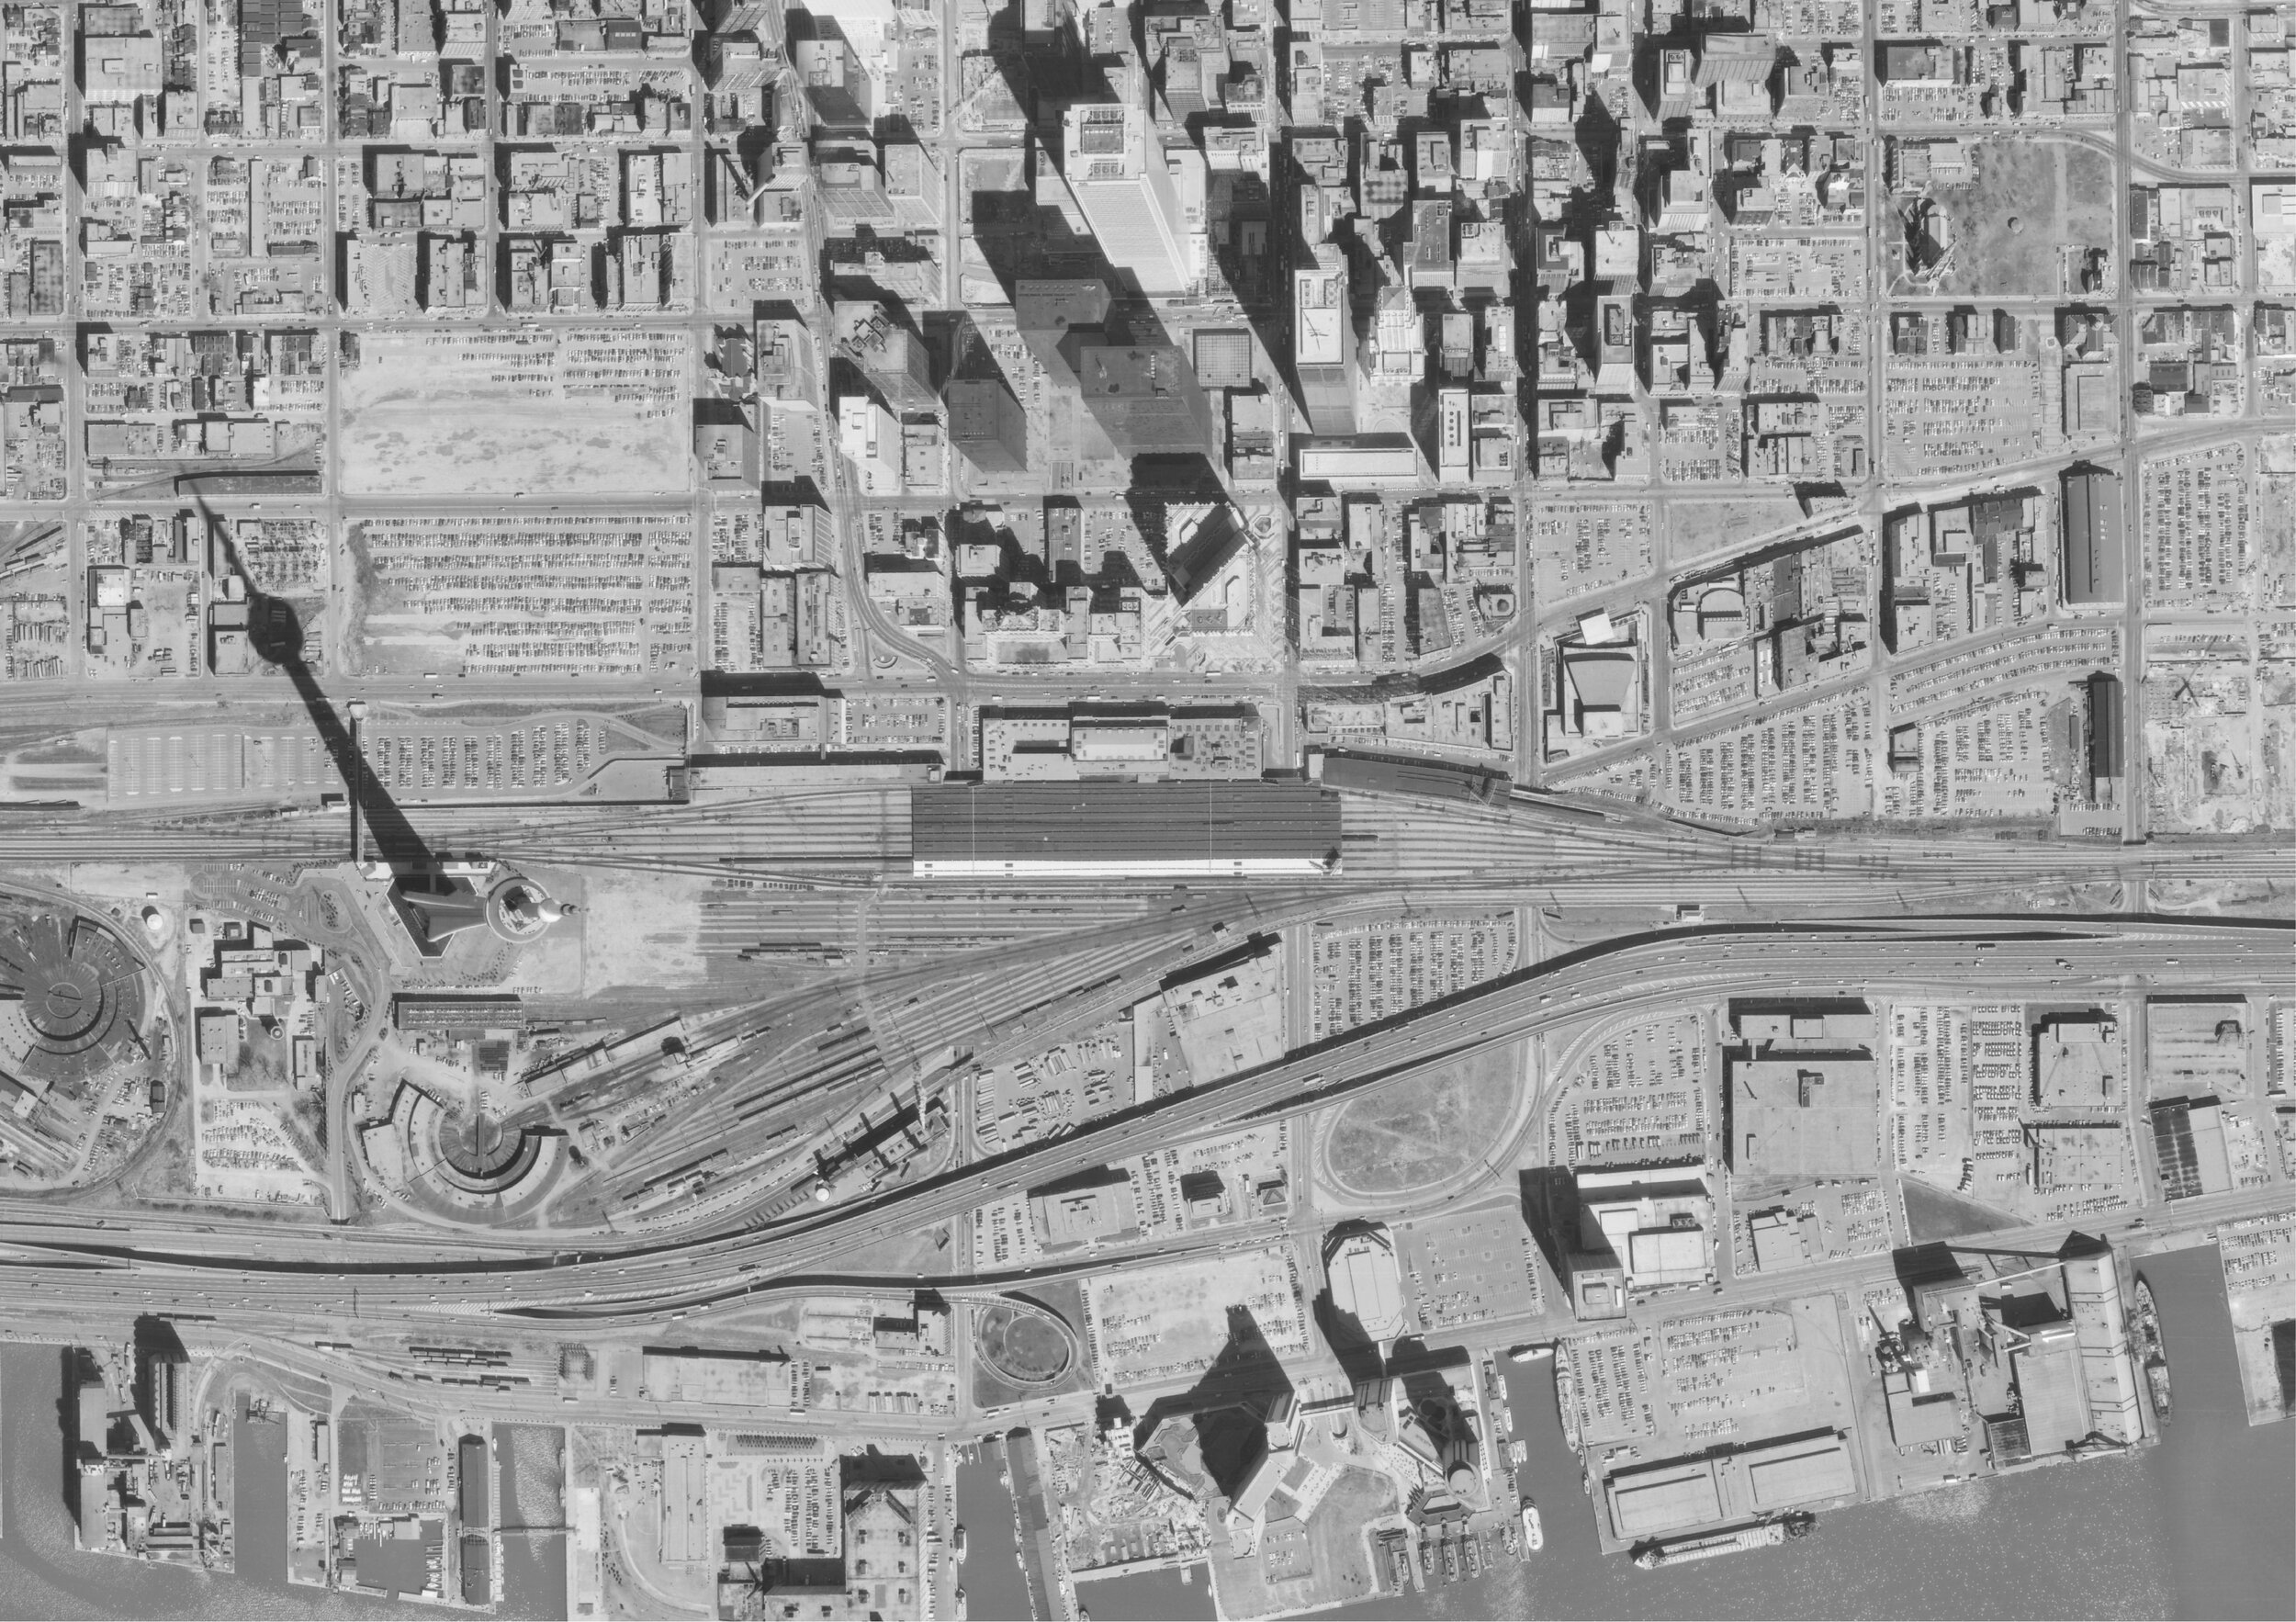
In 1978 Toronto’s downtown had massive areas dedicated to surface parking. Many of these areas resembled the giant suburban parking lots you see adjacent to today’s commuter train stations, but within walking distance of Toronto’s central business district.
Over the past 40 years real estate developers and city council have slowly transformed these essentially vacant lots to accommodate some of Toronto’s most iconic structures, such as the Skydome (or whatever it’s called now), the ACC (ditto), and many other residential buildings, hotels and office towers.
Using historical aerial imagery and data describing the current extent of surface parking in Toronto’s – from the City of Toronto’s Open Data Portal, we were able to quantify this decades-long transition. The maps below show all surface parking in black for years 1978 and 2019.
Sidenote - since its inception the Toronto Open Data Portal has been an incredible resource and recently they have accelerated their offerings, which we very much appreciate.
1978

2019

How did we do this?
By slowly scanning the 1978 imagery, block by block, within Toronto’s downtown core (Bathurst Street to the Don Valley and Bloor Street to Lake Ontario) and tracing the visible surface parking lots we were able to create a GIS layer of historical surface parking similar to that released for 2019 (we also used the 2019 parking lot layer as a guide and borrowed polygons that were minimally altered).
We also looked at the buildings that now stand in place of the old surface parking lots (more on that below) by comparing our new layer (of old parking lots) to the 3D Massing data, which shows all individual buildings in the City of Toronto.
What does this redevelopment look like?
One of the best examples of monumental transformation is the lots at the current site of Metro Hall, CBC Broadcast Centre, Ritz-Carleton, David Pecaut Square, and Roy Thompson Hall. We’ve zoomed into that area in the imagery below.
Metro Hall (1978-2019)
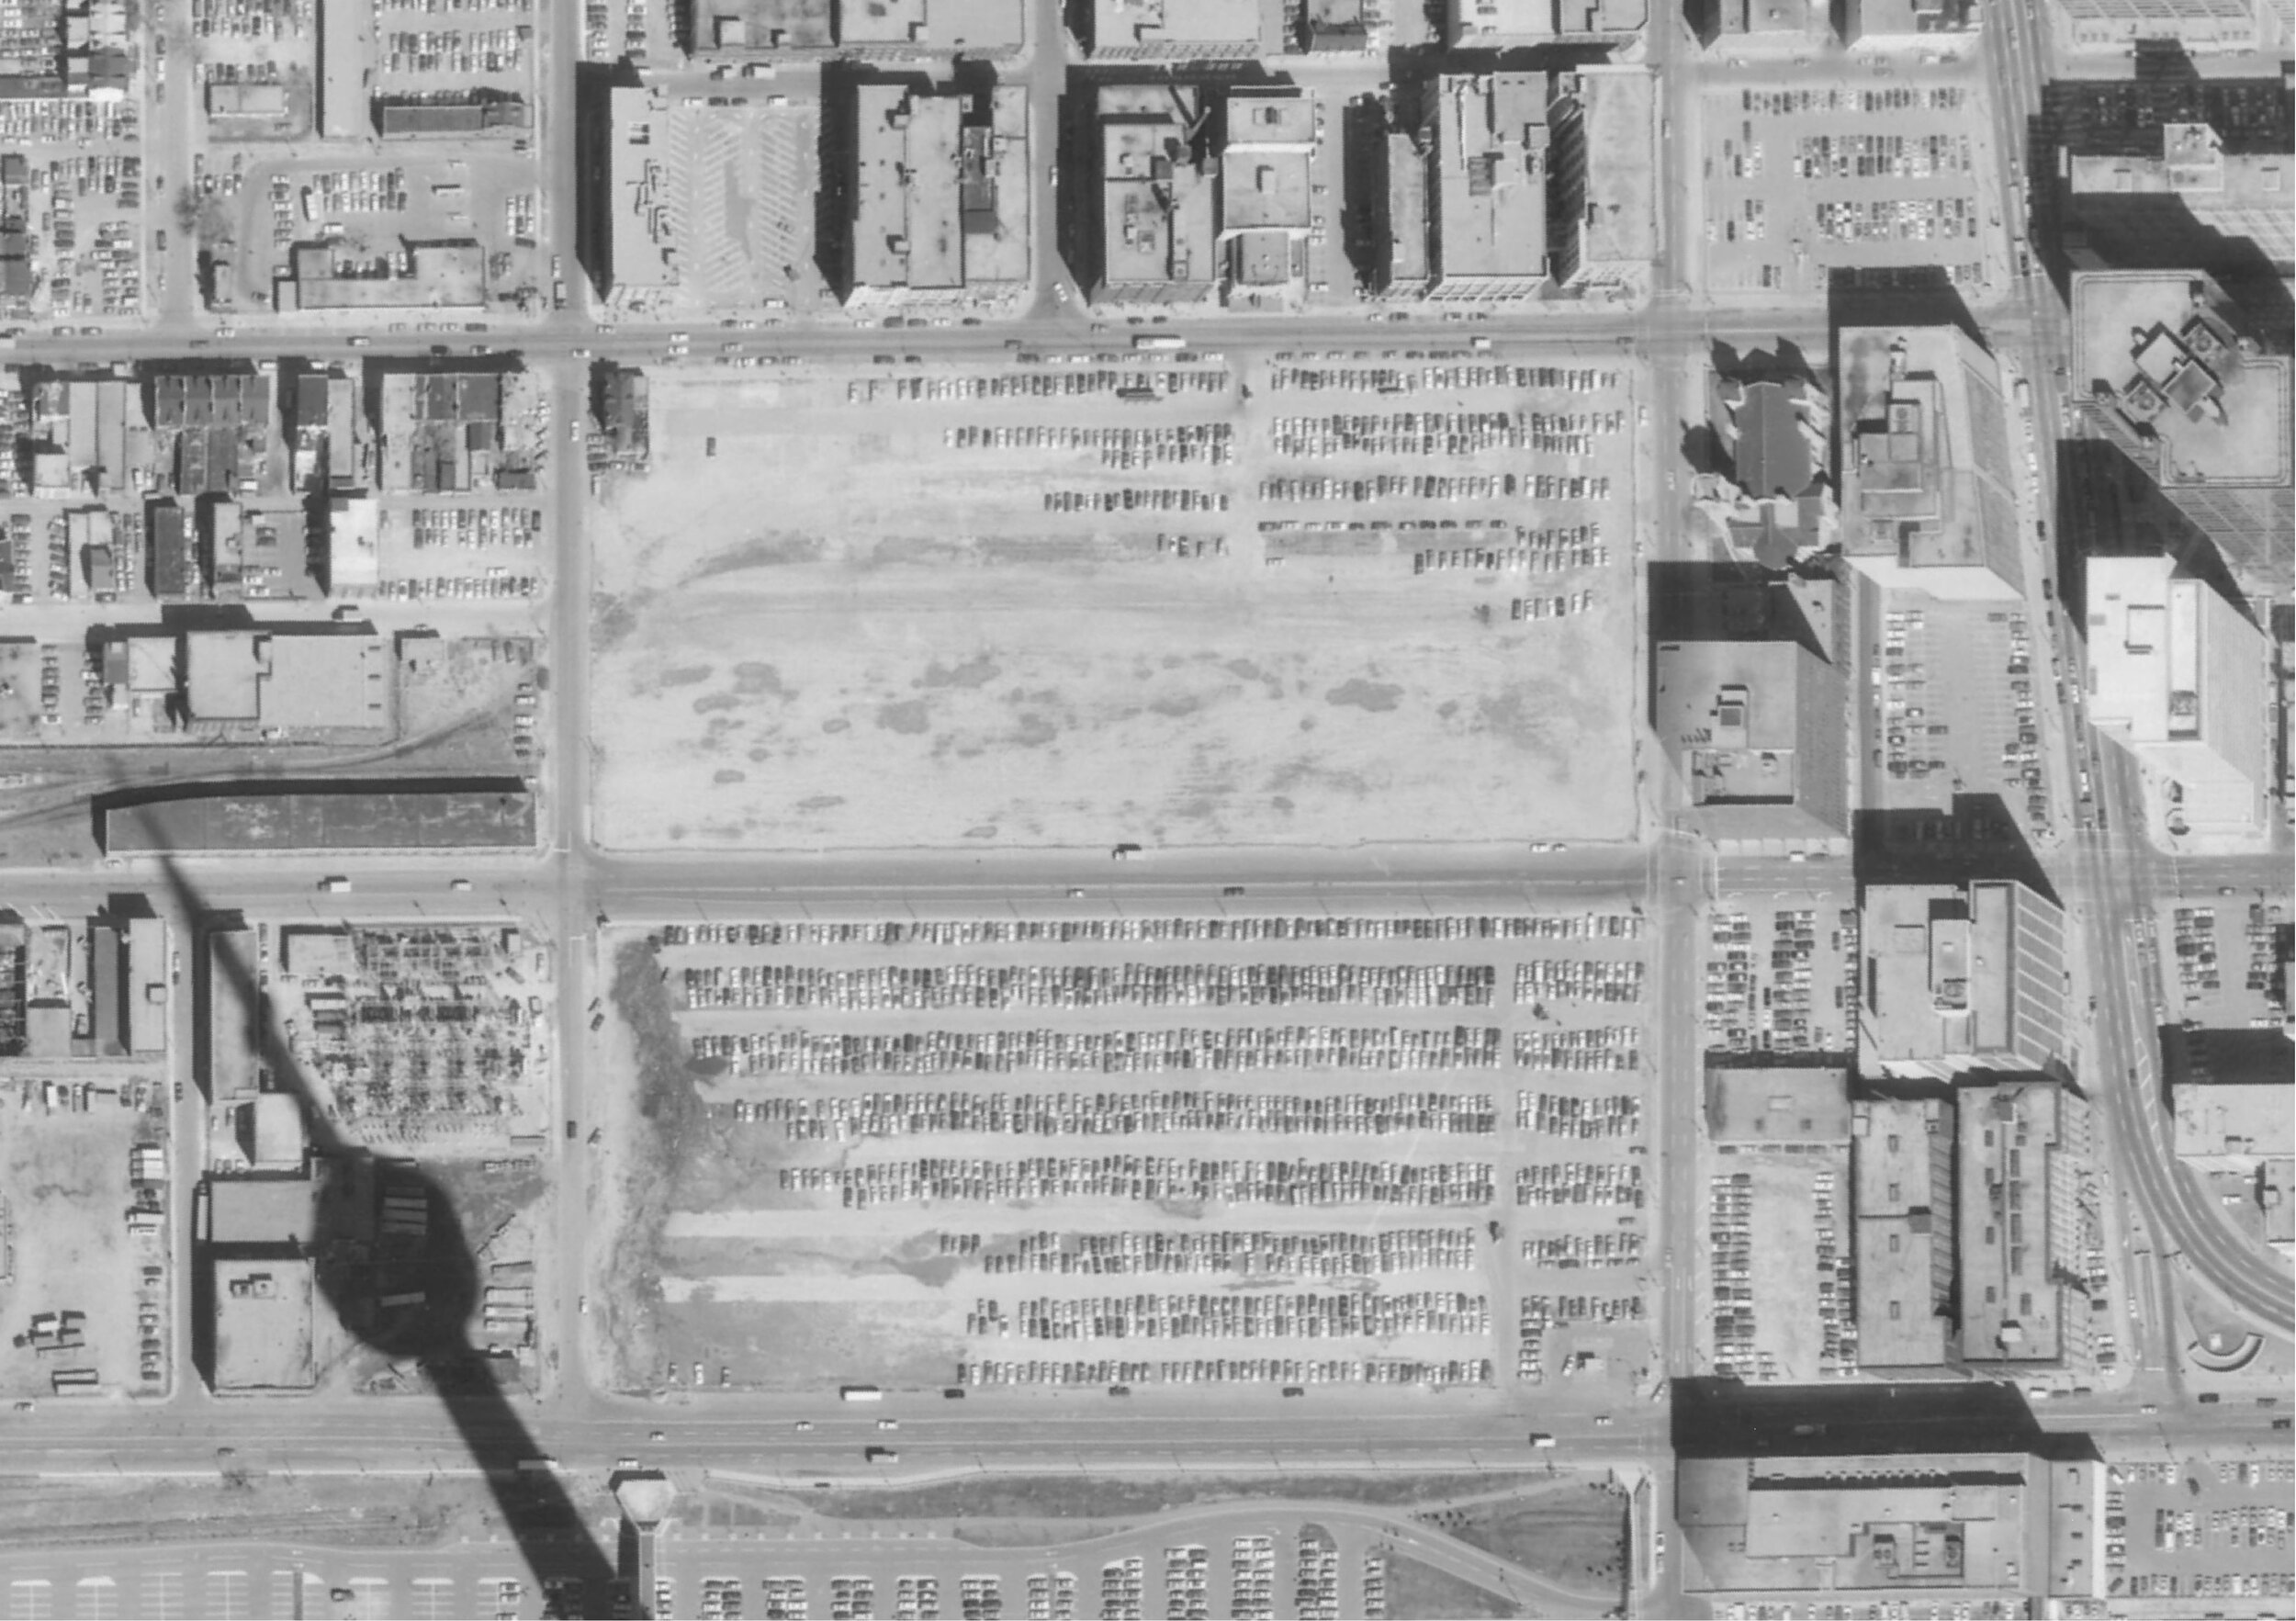
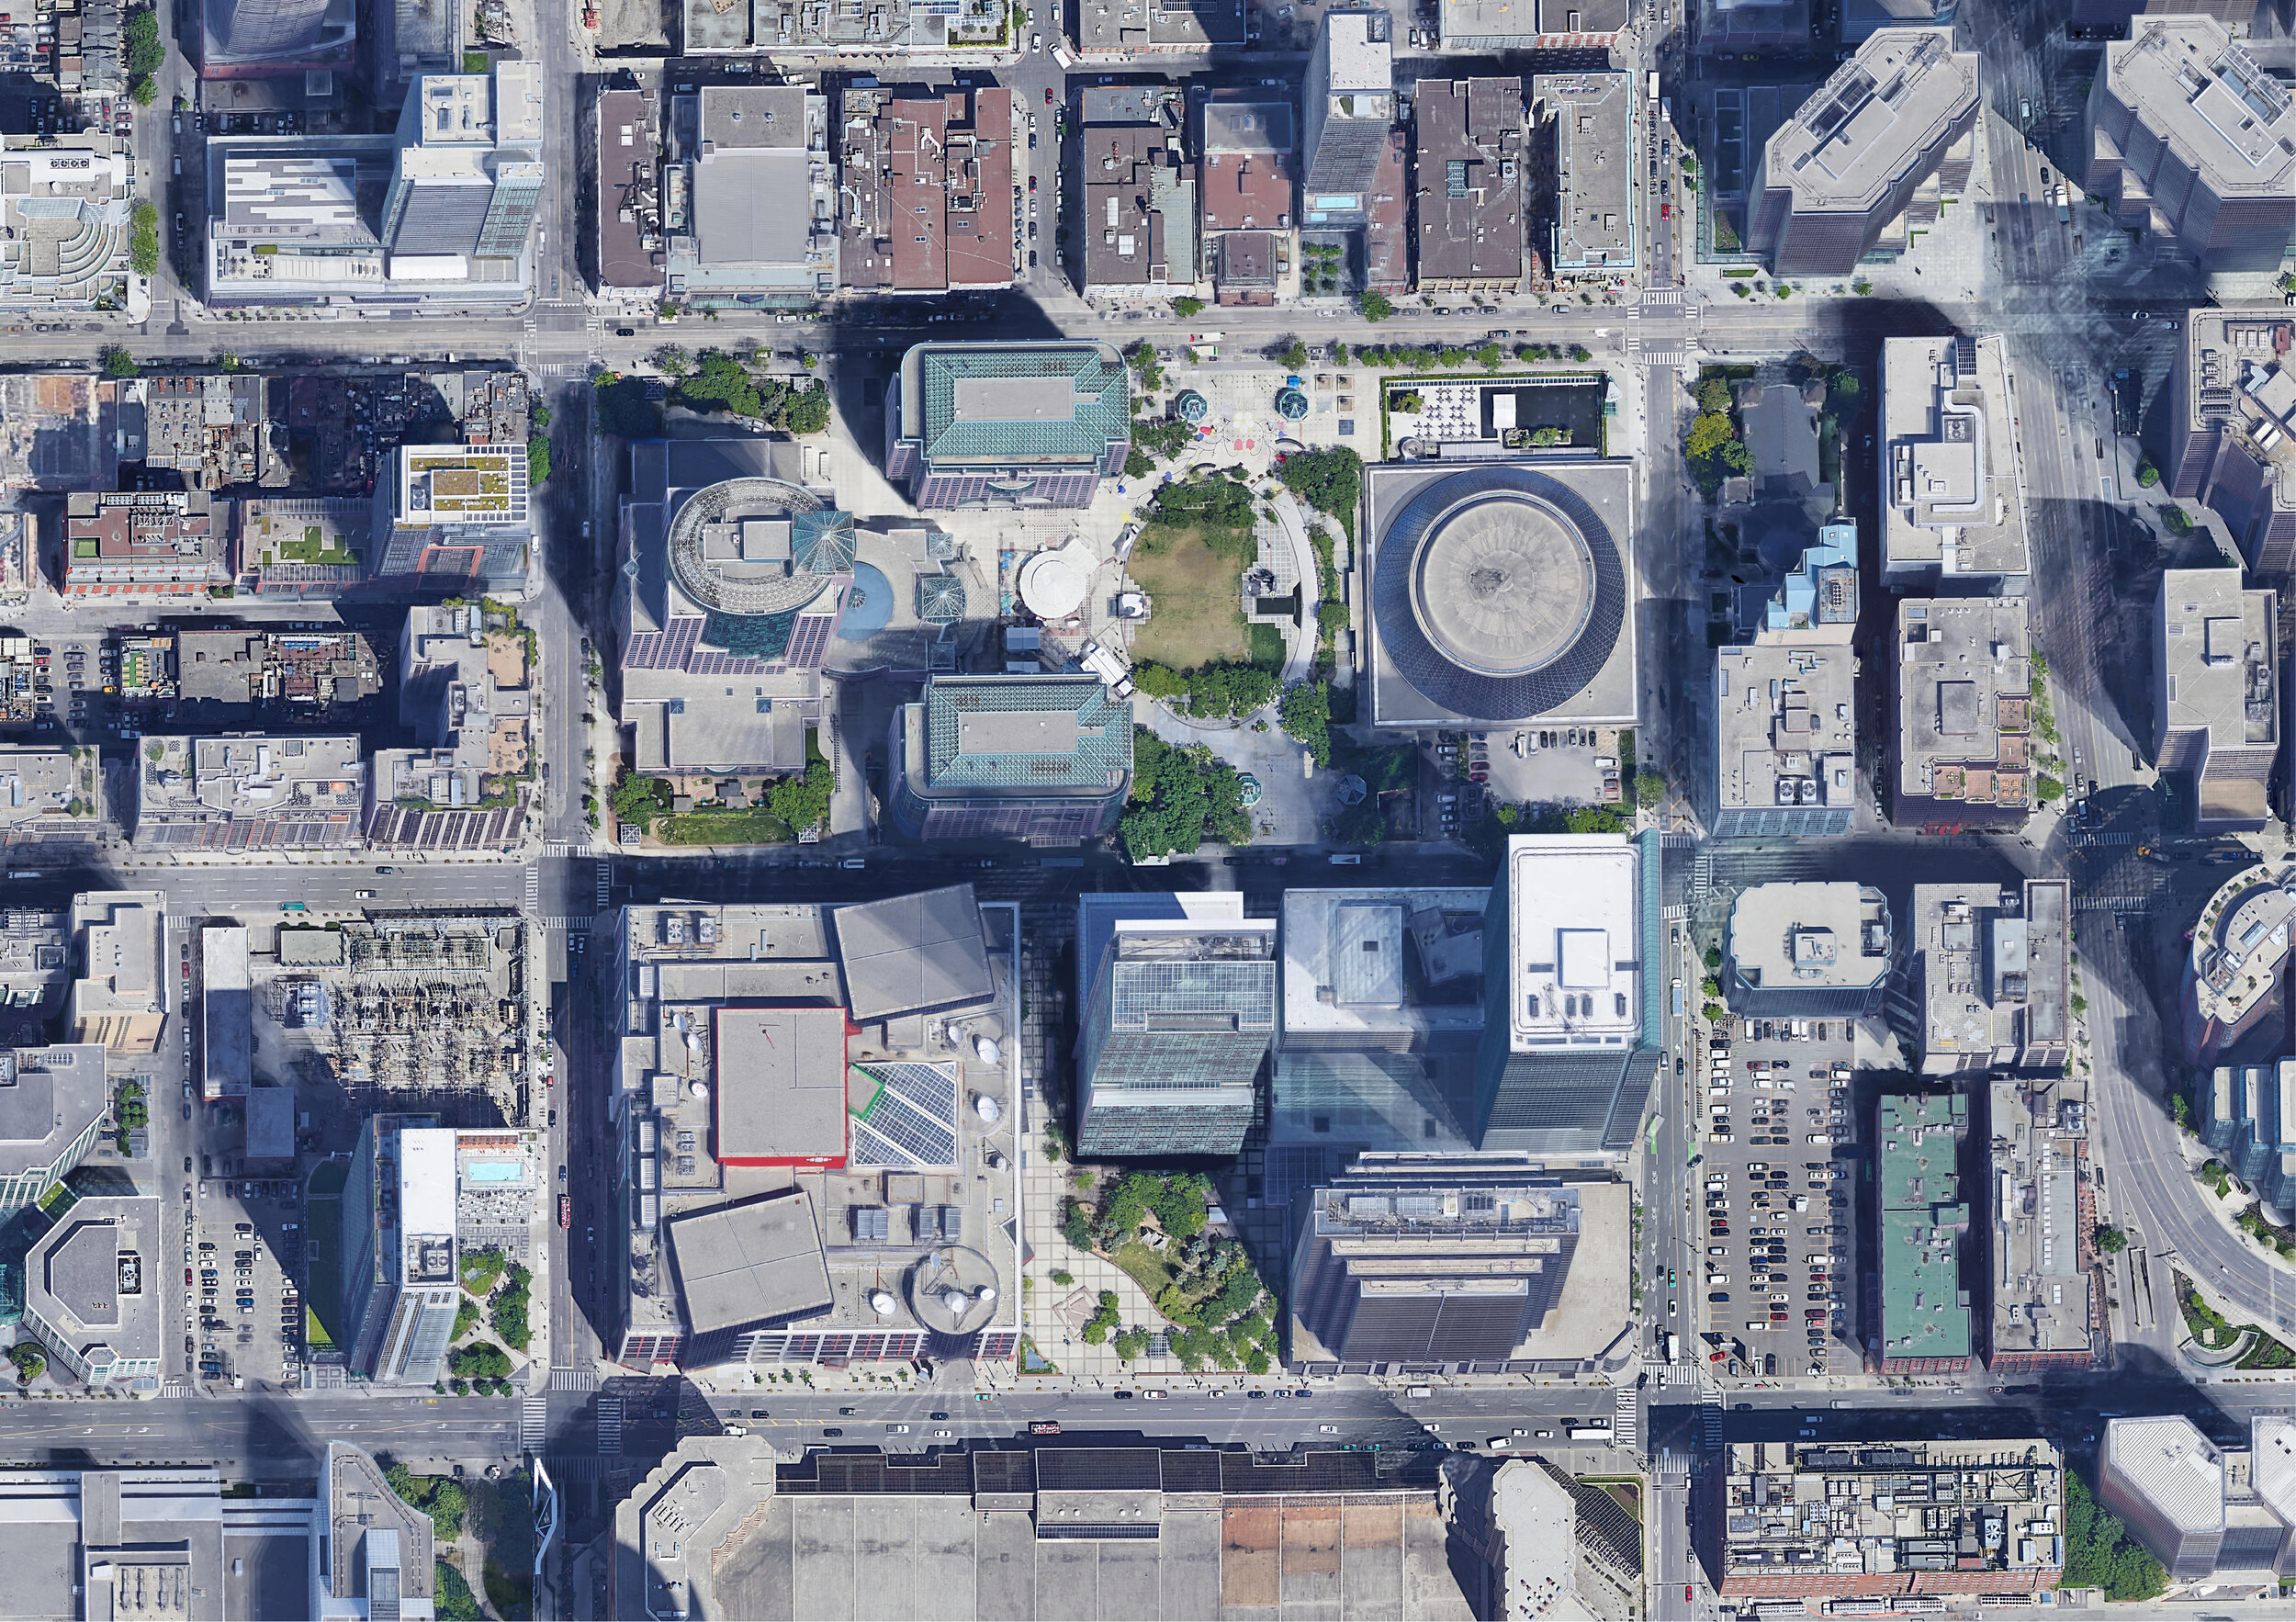
Imagery: City of Toronto (1978); Google Maps (2019)
There are also examples where the decline in manufacturing uses within the downtown core lead to the addition of major surface parking within this time period.
Quayside (1978 - 2019)
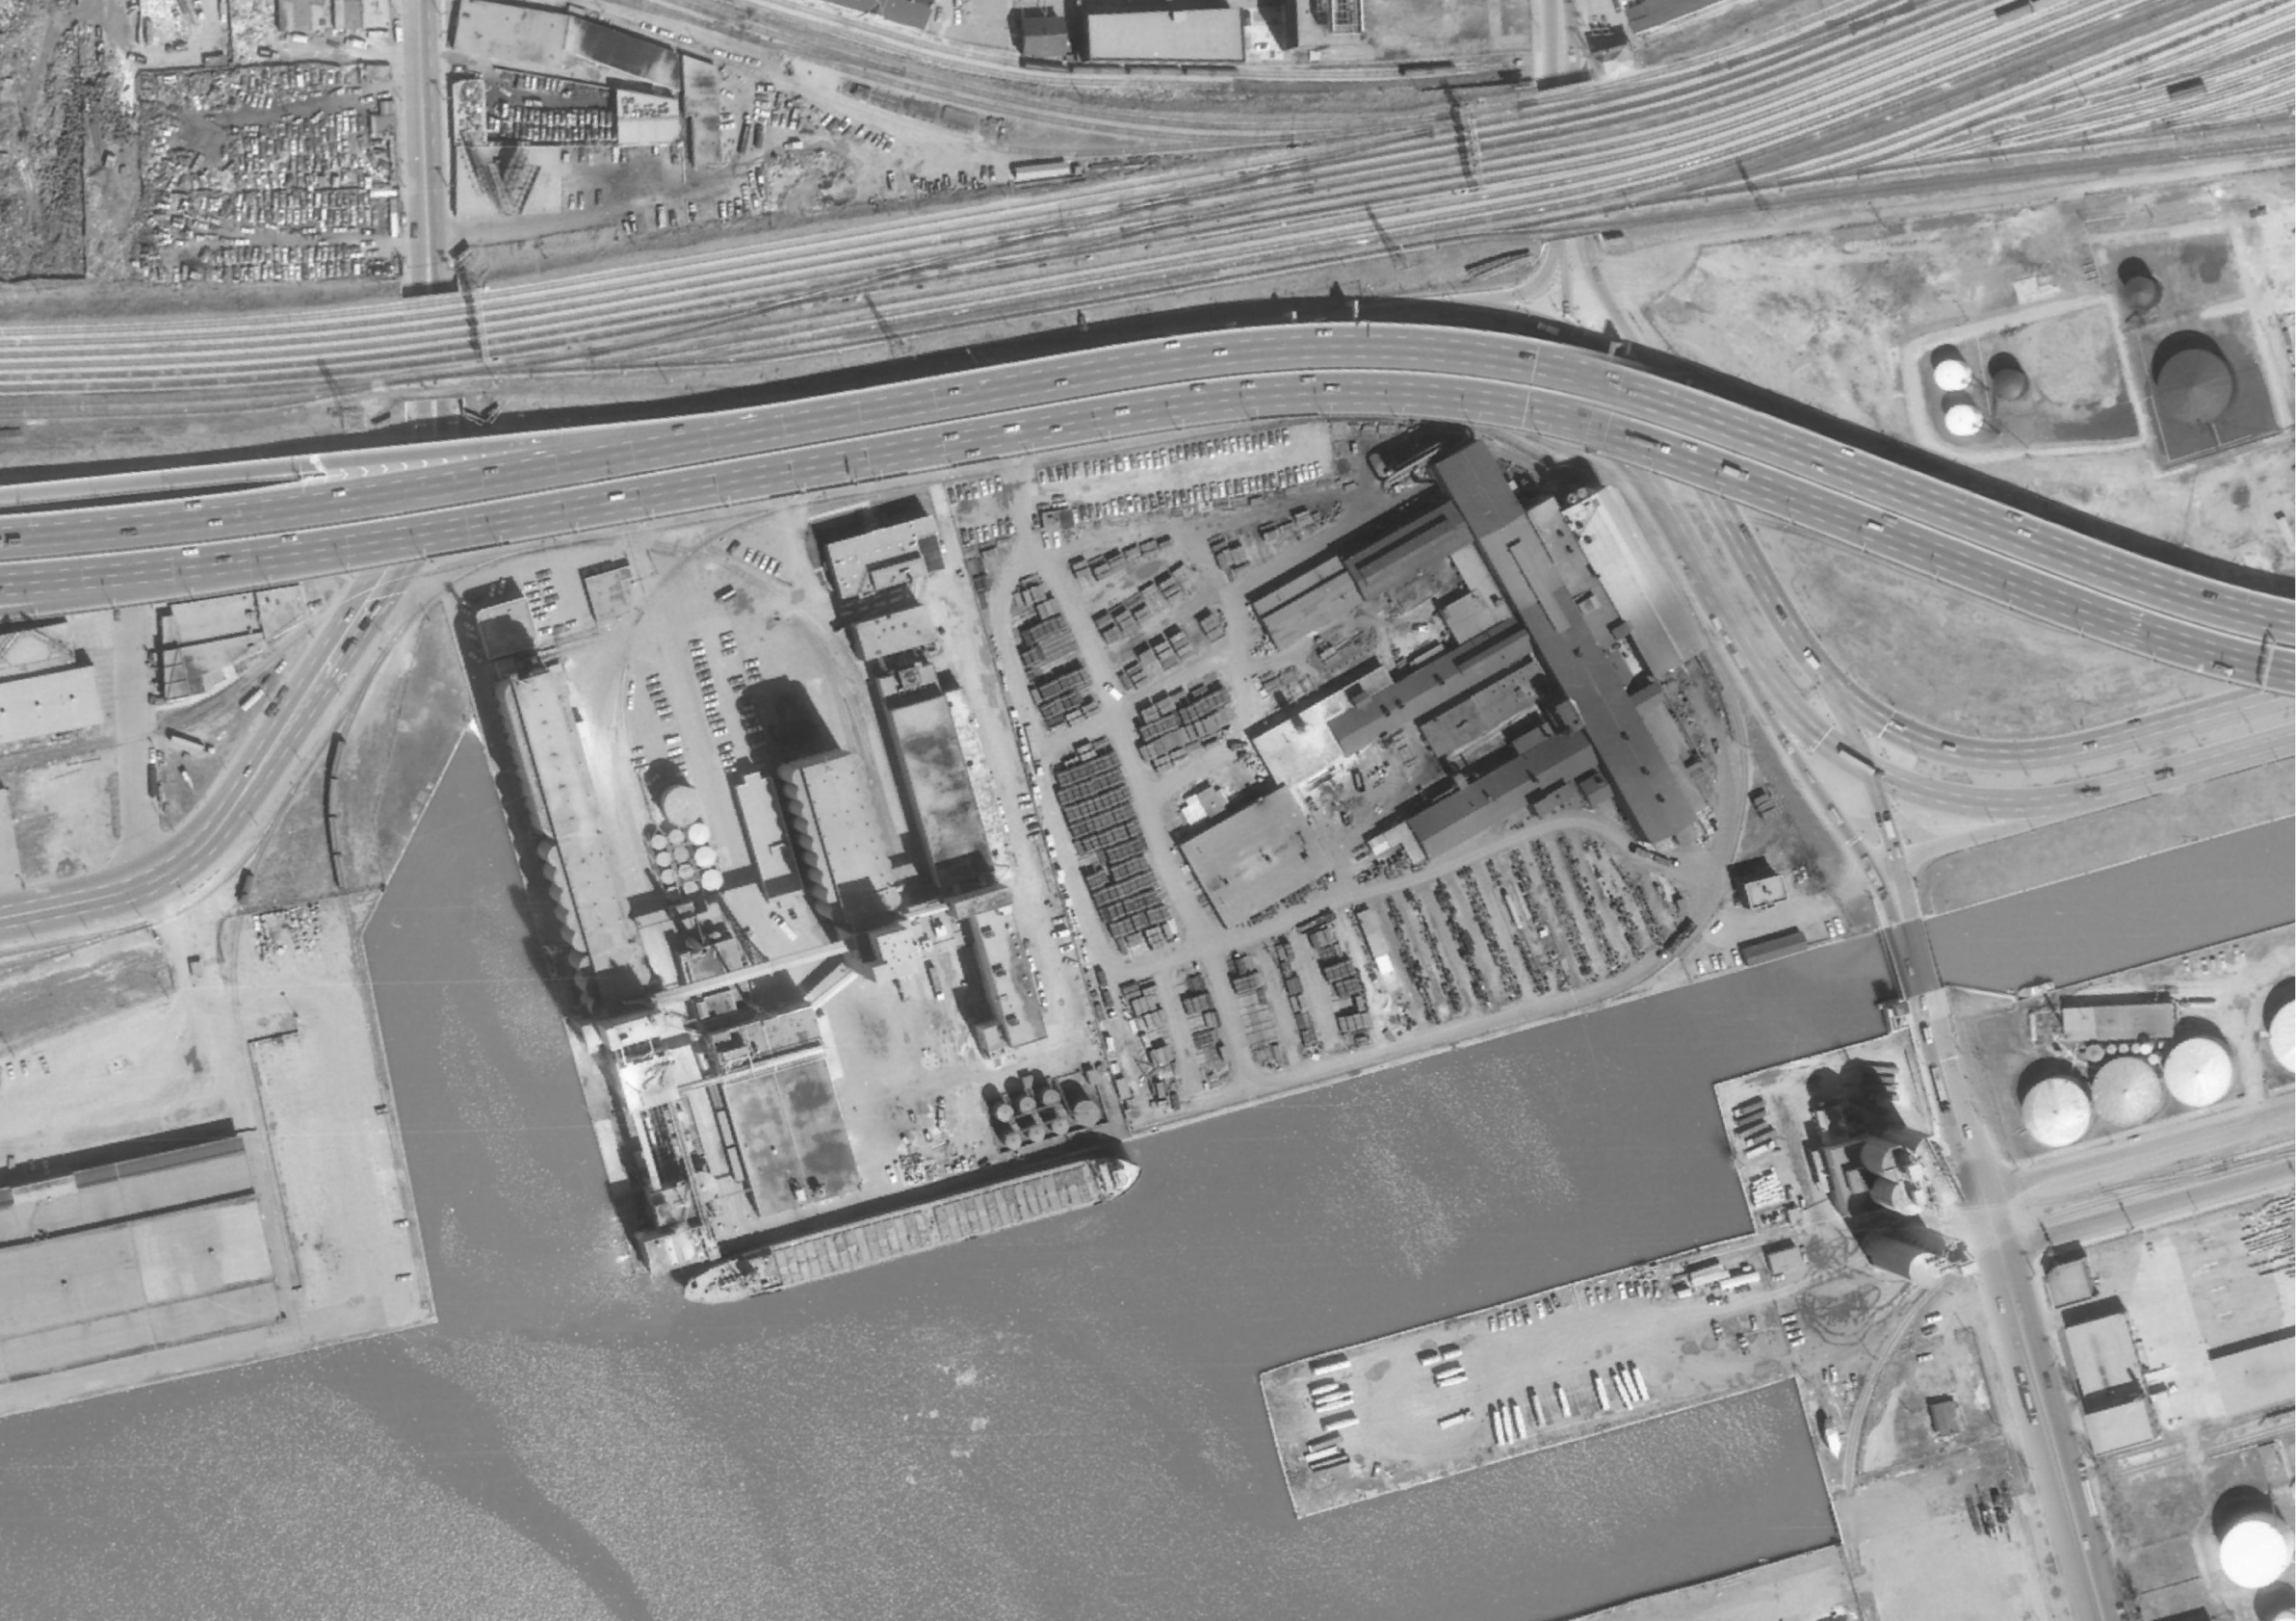
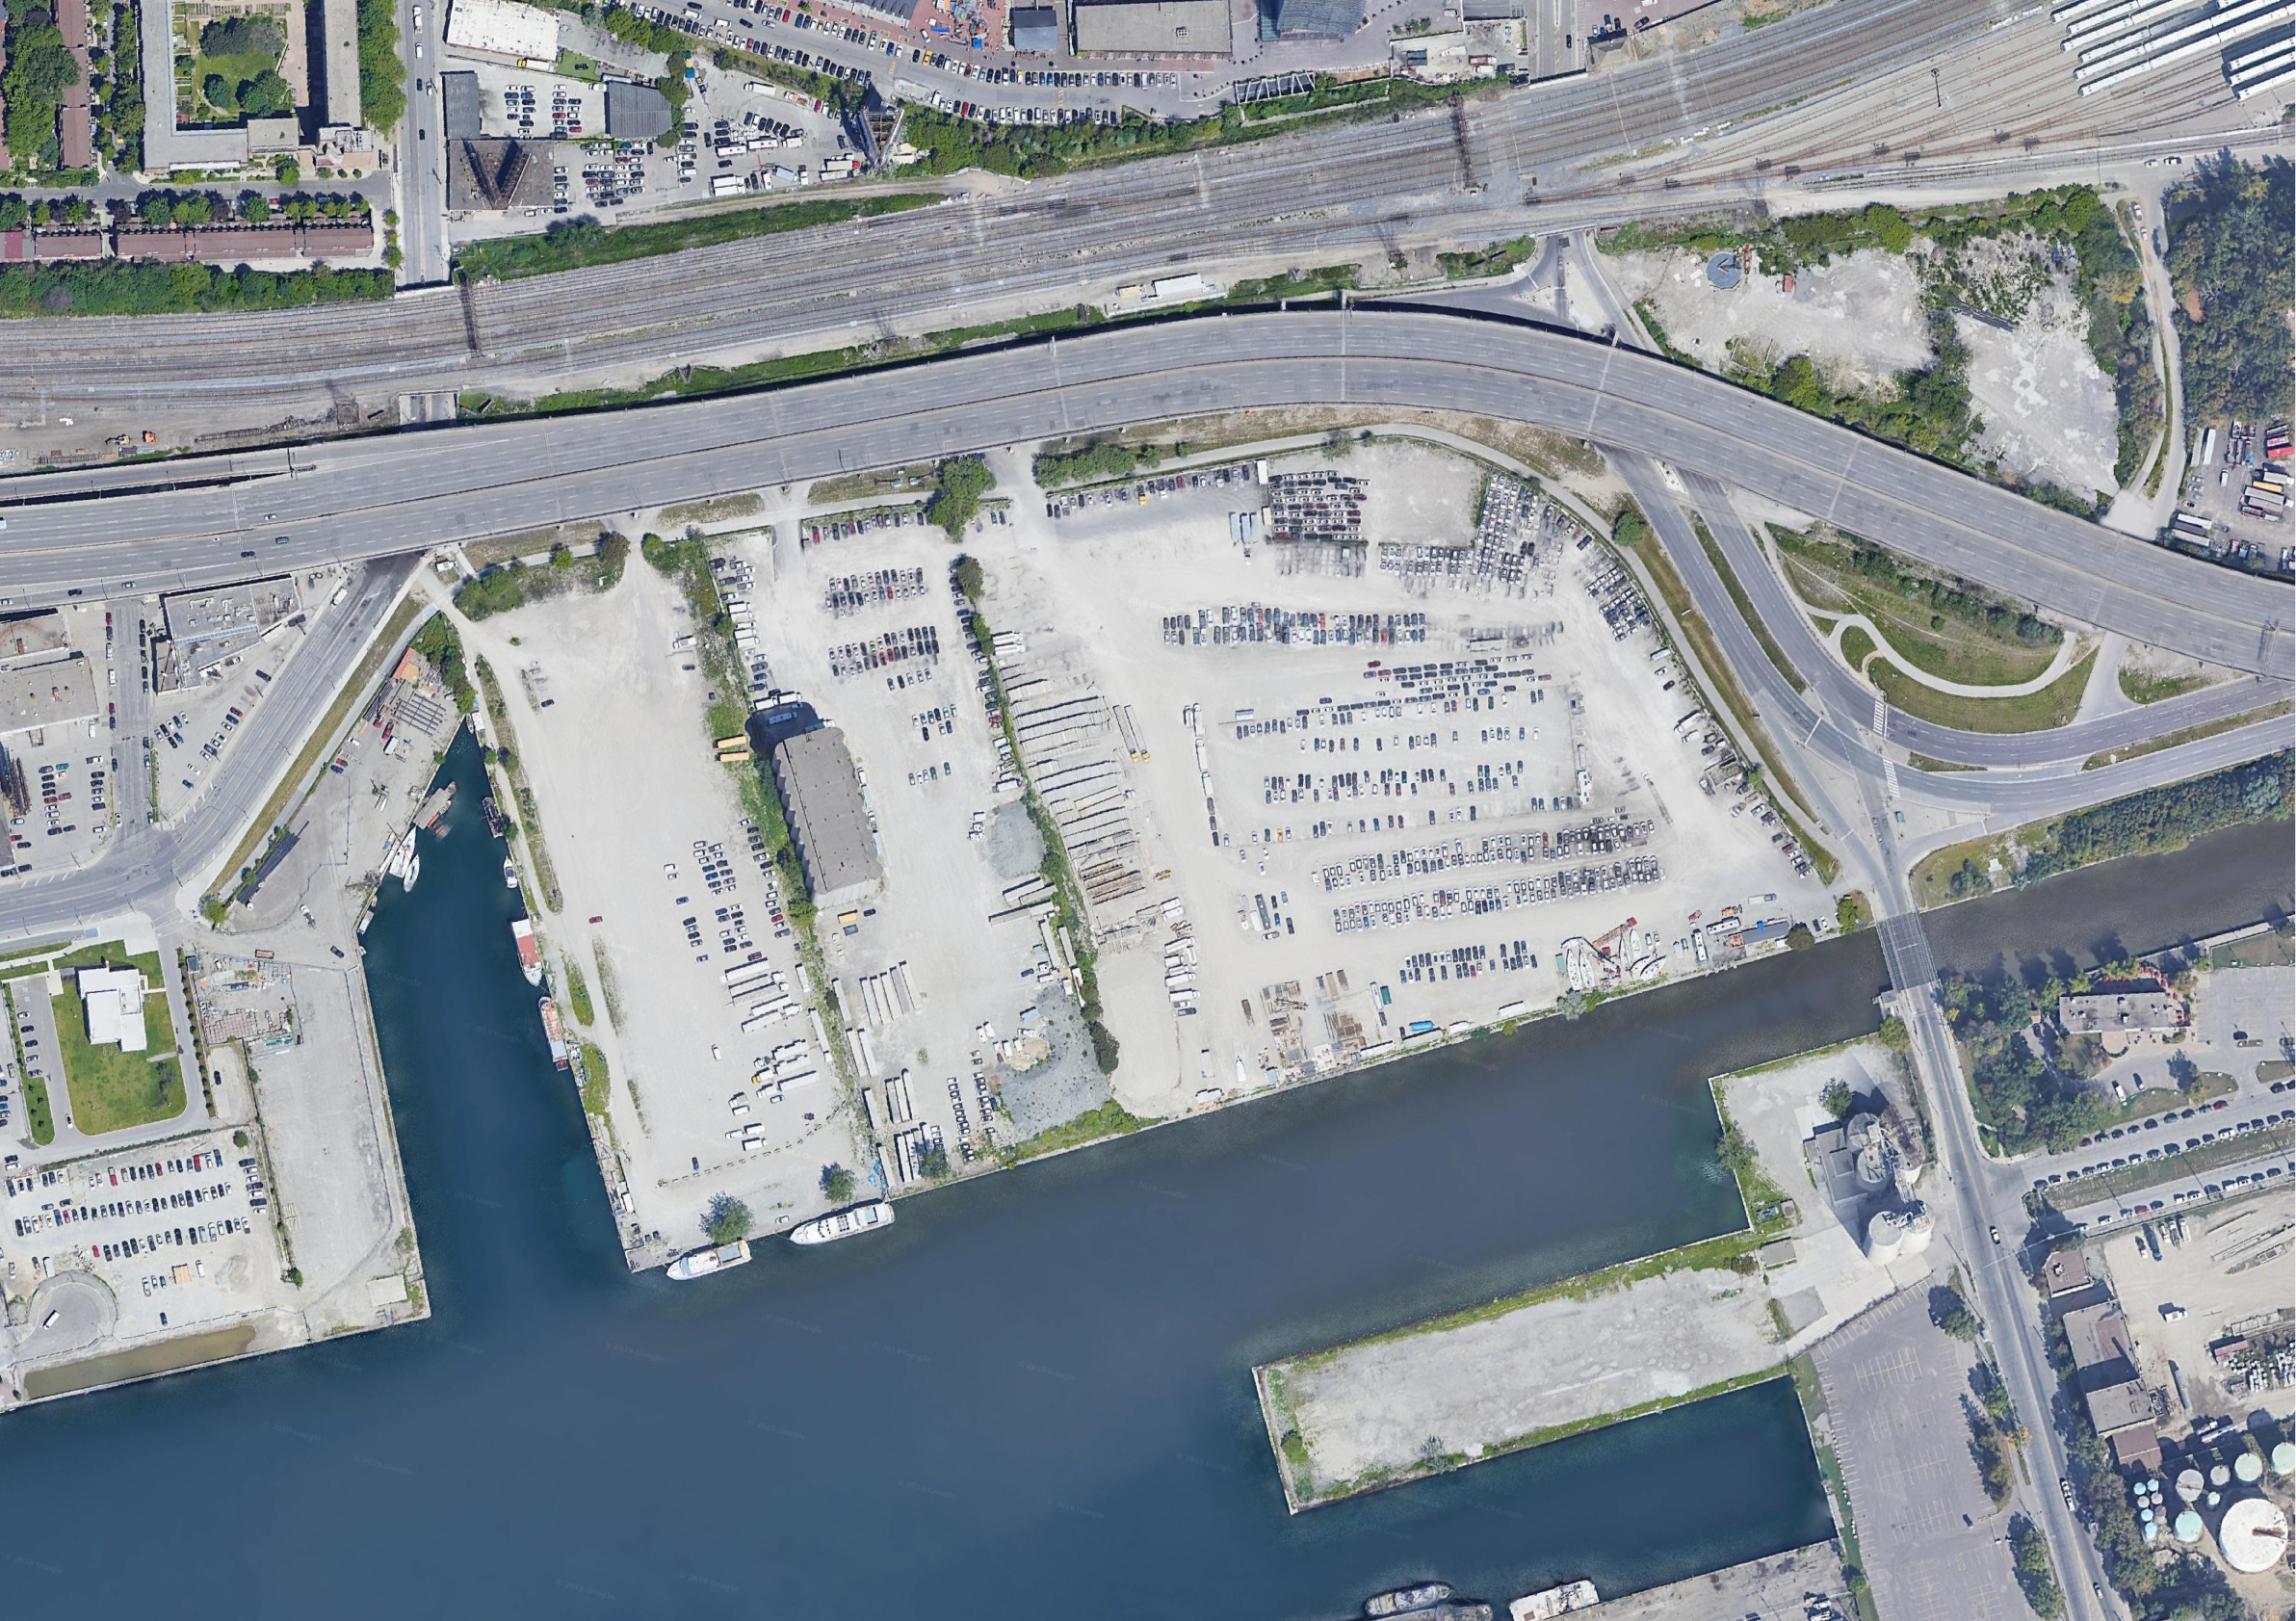
Imagery: City of Toronto (1978); Google Maps (2019)
The images above show the industrial area surrounding the Victory Soya Mills Silos in 1978 and as it is today. The silos were once part of a soybean processing facility that operated from 1944 until 1991. This is also where the Quayside portion of Alphabet’s Sidewalk Labs are proposed.
How do these examples fit into the larger trend?
Overall, our quick number crunching showed that Toronto has redeveloped roughly 40% of its surface parking between 1978 and 2019, although the analysis has some limitations (noted at the end).
In the chart below we’ve calculated the total parking area within 100m intervals emanating from King St. and Bay St. in 1978 and 2019 to summarize the geographic change.
You can see there used to be a lot more surface parking space available within a 1 km buffer of Toronto’s downtown. The majority of this space has now been redeveloped into higher-density development and it appears that the availability of surface parking has dropped significantly between 1978 and today.
Total surface parking within the downtown core

Imagery: Victory Soya Mills Silos (Wikipedia)

It seems important to note that many of these higher-density developments that replaced surface parking lots have also come with a massive number of parking spaces underground. The chart above might look very different if we included total parking space within the downtown core, rather than just surface parking area. It’s entirely possible that there is even more parking available today within a 1 km buffer of King and Bay with the development of the rail lands and multiple layers of underground parking below each new high-rise development.
How much did we build on all those parking lots?
Using the City of Toronto 3D Massing file (which contains the area of each building’s floor plate and the height in metres) we were able to estimate the approximate number of storeys and the approximate amount of floor space added to the city in place of these parking spaces. Overall we estimated that:
Approximately 15,000 storeys and 230 million square feet of building space were added. This is equivalent to:
200+
First Canadian Places (72 Storeys)
300+
Metro Halls
(740K Square Feet)
It’s difficult to imagine what our downtown would look like today if the transformation of the downtown surface parking lots hadn’t taken place the way it did. This analysis also raises other interesting questions about our history. What was there before these parking lots? How many historical buildings were demolished to make way for car storage? That’s research for another time, but from our current perspective it is clear that Toronto now has a much more vibrant downtown with more space dedicated to housing, employment, commercial activity, pedestrians, cyclists, and all sorts of recreational activities. It is positive to see the city reclaim this space from such an inefficient and one-dimensional use and it will be fascinating to see what happens with those that are left.
Limitations: While we tried our best to outline all of the historical surface parking space in Toronto’s downtown core, it is very difficult to create an exhaustive inventory using the 1978 aerial imagery. Shadows from tall buildings made it impossible to see the ground below, empty lots that didn’t clearly reserve its space for parking, and the unpaved industrial spaces near the railway made a lot of the tracing inaccurate. The modern parking lot inventory also includes driveways and some street parking (spaces on Spadina Ave. south of College) that were difficult to digitize in the historic aerial imagery. If anything the count of historic surface parking lots is underestimating the prevalence of them in 1978.
Assumptions:
When estimating the floor space and number of storeys added to the city we took several steps:
Selected all buildings from the 3D Massing file that overlapped the parking lots from 1978.
Divided the height of each building by 4.3 m (an average ceiling height, according to Wikipedia) to get the number of storeys in each building
Multiplied the number of storeys by the floorplate area to get the total floor space (noting also that buildings are broken into multiple sections when the shape changes significantly, such as towers on podiums).